
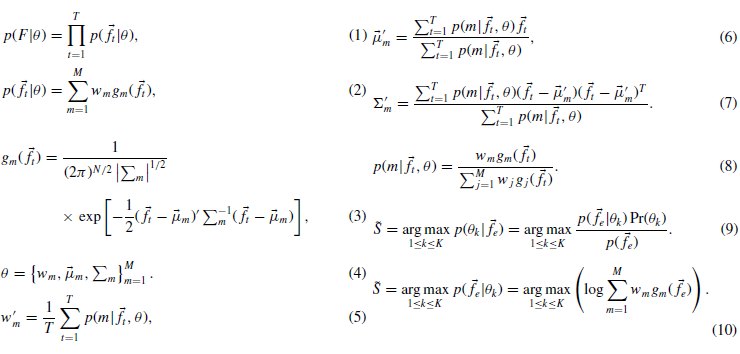
ONGOING PROJECTS
- Development of Remote Radiation Detection Imaging System Mounted on a Drone
- High Resolution SPECT using Variable Pinhole Collimator
- Positioning Algorithm for CZT Virtual Frisch-grid Detector
- Multi-purpose Super-resolution Gamma Detector
- Multi-pinhole SPECT
- Low Profile Light Guide using Diffusion Film
- Advanced Reconstruction for Radiation imaging (ARRA)
COMPLETED PROJECTS
- Reconstruction of Dose Distribution in In-beam PET for Carbon Theraphy
- Image Registration for Breast Cancer Study
- High Energy Collimator Design for I-131
- Plasma-Display-Panel based X-ray Detector (PXD)
- CCD based Gamma Camera
- Abdomen Registration for PET/CT and MR images
- Performance Optimization by Patient Dose Analysis and Image Quality Assessment in CT Fluoroscopy
- Cone-beam based system matrix for a pixelated SPECT detector
- Development of Time-of-Flight Method for Improvement of Signal-to-Noise Ratio
Novel positioning method using Gaussian mixture model for a monolithic scintillator-based detector in positron emission tomography
Introduction
Current designs of commercial positron emission tomography (PET) scanners are primarily based on block detectors with matrices of discrete crystals. These detectors require small crystal cross-sections to obtain high resolution. However, making the crystals narrower for high resolution causes several problems including intercrystal scatter, light collection difficulty, manufacturing difficulties in achieving consistent crystal size, and the high cost associated with fine crystal cutting and treatment. By using one large monolithic scintillator, such problems can be overcome, and detector cost can be significantly reduced while improving performance to some extent.
Accurate position decoding of incident photons on a monolithic scintillator block is one of the key issues in achieving high resolution for scintillation-based photon detectors. Classical Anger's logic has been widely used since it can estimate the position of an incident photon by applying a simple equation for each coordinate. One of the major drawbacks of Anger's logic is that it shrinks the useful field of view of the detector and degrades resolution and bias, typically at the corner. It also causes a pincushion effect through the boundary, thereby introducing nonlinearities that distort the useful field of view and degrade the spatial resolution of the image.
Statistical methods have been proposed to improve the accuracy of position estimation as compared to Anger's method. Joung et al. proposed a maximum likelihood-based algorithm that improves positioning characteristics near the edge of a crystal for a continuous miniature crystal element detector consisting of a 25 mm × 25 mm × 4 mm thick slab of lutetium oxyorthosilicate (LSO) coupled to a position-sensitive photomultiplier tube (PMT). Miyaoka et al. improved the algorithm by using a depth-dependent light response model with two to four clusters of depth-of-interactions (DOIs) within a single slab scintillator. This method showed high precision decoding performance. However, it is very difficult to train the statistical model (mean and variance) from multiple DOI locations in the experimental environment. Another approach was proposed by Mateo et al. and Aliaga et al. They employed an artificial neural network (ANN) to classify the location of incident photons. Instead of determining the three-dimensional (3D) location of an incident photon by DOI clustering, they combined the light responses from all the depth positions and estimated the original spatial location of the incident photon on the surface of the scintillator. They built an ANN estimator for a two-dimensional spatial location of incident photons with DOI information, successfully decoded the spatial resolution with a 4 to 5 mm pixel grid, and improved the positioning bias at the PMT boundary as compared to Anger's centroid logic.
The goal of this study is twofold: 1. to develop a positioning method by using simple light response models that combine all depth information to produce high precision decoding performance (∼1.5 mm), and 2. to enhance the degradation of edge performance that is typically observed in Anger's method. To achieve these goals, we employed a Gaussian mixture model (GMM) that has been widely used in pattern recognition research.13, 14 Instead of using a single and separate Gaussian model for each depth,12 the composite light response acquired in a photomultiplier tube is modeled with multiple Gaussians regardless of depth. Light distribution acquired by a PMT channel was used as a feature, and N-dimensional features from all the channels were fed into a GMM training model with M mixtures. Then, we decoded the spatial location of incident photons with the trained models. While the proposed algorithm showed acceptable results at the center, we concentrated more on enhancing the decoding performance at the boundary and corner of the scintillator.
Materials and Methods
1) Simulation Condition
The DETECT2000 simulation package was used to model the detector module. The crystal was a 48.8 × 48.8 × 10 mm slab of LSO (index of refraction = 1.85). The two crystal surfaces were polished. One side was directly coupled (i.e., no light guide) to the PMT with 0.5 mm of 1.44 index optical glue. The other side was painted using a diffuse reflector with a reflection coefficient (RC) of 0.98. The short sides were painted with low reflectivity paint (RC = 0.10). An 8×8 array of anode pads (i.e., a DETECT2000 surface), 5.8 mm × 5.8 mm with 6.08 mm center-to-center spacing, was placed on the back side of a 2-mm thick glass PMT window to emulate a 64-channel flat panel PMT (Hamamatsu H8500, Japan). 2500 light photons were produced per detected event. This accounts for the light produced by the LSO and the quantum efficiency of the PMT's photocathode. The crystal was divided into 0.1-mm thick DOI slices. The number of interactions in each DOI slice was adjusted to take into account the linear attenuation coefficient of the LSO. However, within each 0.1 mm zone, the probability of interaction was equally distributed.

Fig. 1. Illustration of simulation model for DETECT2000. (a) Dimension of target detector. (b) Grid locations where incident photons were simulated.
The grid shown in Fig. 1 was used to characterize a region of the detector. Symmetry was used to generate the full detector lookup table (i.e., 33×33). The grid spacing was 1.52 mm (i.e., 1/4 of the PMT anode pixel pitch distance). Each dot represented a point photon flux of 511 keV photons perpendicular to the crystal surface. A flux of 113,000 incident photons was used to characterize the detector, and the same number of incident photons was separately simulated and used to evaluate the positioning characteristics.
2) GMM Estimator
Given a collimated source of incident gamma photons emitted perpendicular to the scintillator's surface, we denote fi, a vector of elements fi(i = 1, 2,. . . ,N), as the number of light photons arriving at each PMT channel. For a sequence of T training vectors F = {f1, . . . , fT}, the GMM likelihood at each spatial position is calculated as Eq (1). p(ft|θ) is a weighted sum of M Gaussian mixture densities denoted by Eqs. (2) and (3), and θ is the complete set of mixture density models denoted by Eq. (4).
Given training observation vectors F at a certain spatial position, the goal of training is to estimate the parameter set θ so that the parameter best matches the distribution of the training vectors. To optimize the training model, the expectation maximization (EM) algorithm was used. Beginning with an initial parameter θ, the goal of the EM algorithm is to keep the new parameter θ' estimated such that p(F|θ') ≥ p(F|θ) based on the Baum–Welch algorithm. The new parameter then becomes the initial parameter for the next iteration and the process is repeated until a convergence threshold is reached.
The re-estimated mixture weight, mean vector, and covariance matrix of mixture m was calculated by Eqs. (5)–(7). In these equations, p(m|ft,θ) is the a posteriori probability(Eq. (8)). The evaluation of the position decoding experiment was performed in the following manner. A group of K spatial positions k={1, 2, . . . ,K} is represented by a trained parameter set Θ={θ1, θ2, . . . , θK }. The objective is to find the position model that has the maximum a posteriori probability for a given observation vector fe using the Eq. (9).
Since all the positions have equal probability, Pr(θk) and p(fe) are equal for all k. Using logarithms, Eq. (9) was modified into the final form of the position decoding equation(Eq. (10)).
3) Gaussian Mixture Model and Lookup Table

Fig. 2. Histogram of collected light and the trained Gaussian mixtures at a single PMT channel with (a) a single mixture, (b) two mixtures, and (c) four mixtures.
A sample light collection histogram (i.e., a likelihood function) for a single PMT channel is illustrated in Fig. 2 (solid line) where the number of light photons collected by the PMT channel varies significantly with depth. The incoming photon flux was perpendicular to the scintillator's surface and located at the exact center of the location grid. The energy level of each incoming photon was 511 keV. The dotted lines in Fig. 2 represent a histogram of the light collected by a PMT channel in the center region of the crystal shown in Fig. 1. The nonexponential shape of the high-end tail (the right-hand side of the dotted line) is a result of the depth-dependent light collection.
The LUTs were used by the evaluation function [Eq. (10)] to estimate the location of the detected event. The evaluation function searches the components θk of the LUT and finds one global maximum so that the event can be binned to an X, Y position. For a PMT channel directly below the point where the gamma interacts in the crystal, the amount of light collected will vary significantly with depth. This will lead to an asymmetric light collection histogram for that channel characterized by a high-end tail. By using GMM, asymmetric light collection histograms showed a reasonable fit into multiple 64-dimensional mixtures according to the amount of light collected. This is partially illustrated in Figs. 2(b) and 2(c), where two and four mixtures were applied to the channel data. Since we cannot easily display more than 3D feature clusters, the figure shows the fitting results that belong to the parameter set θi at a certain channel i.
Results

Fig. 3. Detection rate with increasing number of mixtures. (a) Corner section and (b) center section.
The intrinsic spatial resolution was determined for an array of points in the corner and center sections of the crystal as shown in Fig. 1. Light gray dots within the corner and center sections in Fig. 1 represent the points at which the incoming photon flux was simulated. At first, in order to determine the optimal number of mixtures, we calculated detection rates with increasing number of mixtures. As shown in Fig. 3, detection rates were maximized in four and six mixture estimations at both corner and center areas. As summarized in Table 1, six mixtures performed slightly better than four mixtures but we thought that the difference is almost indistinguishable. Meanwhile, as for the efficiency of positioning performance, four mixtures required a smaller size of LUT, thereby ran faster than six mixtures while they still preserved the detection rates almost equivalent to six mixtures. Therefore, we decided to use four mixtures for further experiments.
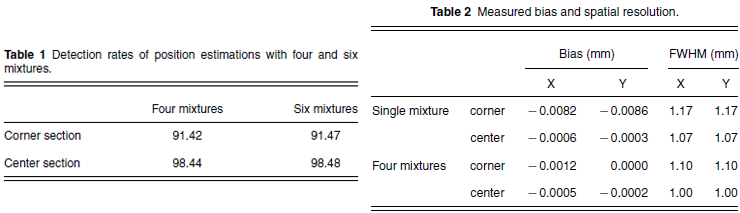
If our approach uses only a single mixture for position estimation, it is corresponding to the method proposed by Joung et al. Thus we compared the performance of our method with the existing method by using four and one mixture estimations, respectively. The flux arrays of the proposed positioning method are illustrated in Fig. 4 and 5 by comparing a single mixture estimation with a four mixture estimation at the corner and center sections, respectively. Figure 6 shows contour plots of corner and center positions together using one mixture [Fig. 6. (a)] and four mixtures [Fig. 6. (b)]. The spatial resolution and estimation bias results are summarized in Table 2. The average full width at half maximum (FWHM) of the intrinsic spatial resolution and offsets from the center in the x and y directions for the center and corner sections are listed. The average spatial resolutions after positioning with one mixture are 1.17 mm FWHM and 1.07 mm FWHM at the corner and center sections, respectively. The resolutions with four mixtures are 1.1 and 1.0 mm FWHM at the corner and center sections, respectively. The bias in the position estimate was negligible for both the central and corner sections of the crystal. Therefore, training Θ with four mixtures (M = 4) gave better results than with a single mixture (M = 1). A significant improvement was observed, especially at the corner section. Figure 7 shows the profiles of the flux arrays displayed in Fig. 6. Again, the four mixture case outperformed the single mixture case at the corner positions.
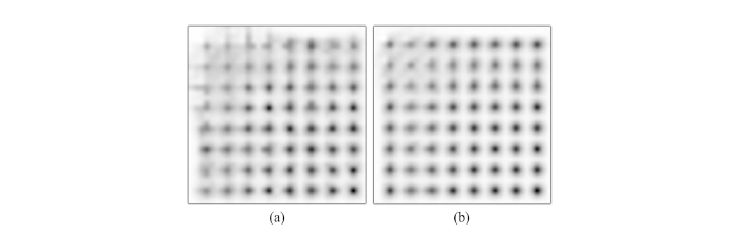
Fig. 4 Estimated positions by the proposed method at the corner illustrated in Fig. 1 (positions from 3.36 to 13.84 mm in both the x- and y-axis). (a) GMM with a single mixture. (b) GMM with four mixtures.
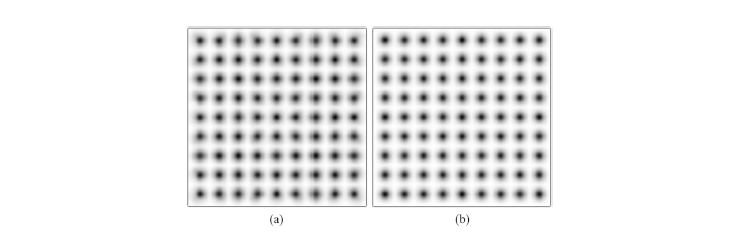
Fig. 5 Estimated positions by the proposed method at the center illustrated in Fig. 1. (a) Flux arrays by GMM with a single mixture. (b) Flux arrays by GMM with four mixtures.
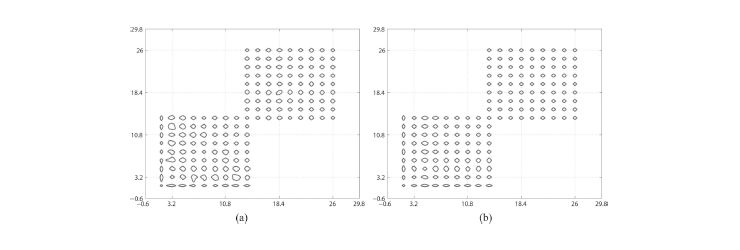
Fig. 6 Contour plots of the proposed positioning algorithm using (a) a single Gaussian mixture, and (b) four Gaussian mixtures.
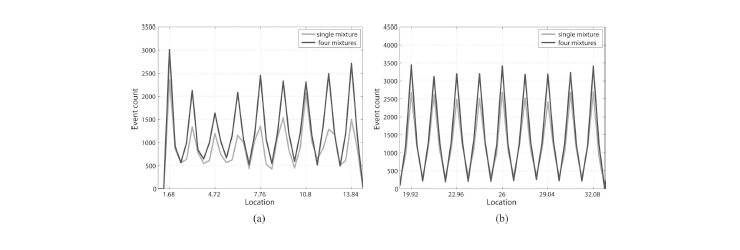
Fig. 7 Profiles along the x-axis of the flux image by the proposed algorithm. (a) Corner section. (b) Center section.
Conclusion
We developed a novel position estimation method for a monolithic scintillator block that achieved high precision position decoding and a significant improvement in edge performance compared to Anger's method. A set of observation vectors, each consisting of collected lights at PMT channels, were trained to optimally model multiple Gaussian mixtures so that the trained parameter set of mixtures represented an accurate position of photon flux. Then, all the trained parameter sets were evaluated with an observation vector to estimate the position of an incident gamma photon on the surface of the scintillator.
We investigated the performance of the proposed algorithm through a DETECT2000 simulation study. The results showed 1 mm spatial resolution at the center and 1.1 mm at the corner positions. No conspicuous bias was observed at any position. The results also indicated that parameters with four mixtures gave the best performance in terms of resolution and bias.
In Fig. 4, we did not show the results at the 1.63 mm positions for the x- and y-axis. A distance of 1.63 mm from the PMT glass falls at the very edge of the crystal as shown in Fig. 1(b); therefore, the shapes of light distributions were significantly distinguished from those in neighboring positions. As a result, positioning accuracy was found to be very high, thereby causing adjacent pixels to be represented with a very low gray level. The overall flux image looks somewhat misty, whereas the corner pixel was very distinctively localized. Therefore, we considered positions from 3.36 mm to be the area at which the algorithm could be effectively applied.
Although our DETECT2000 simulation helped us understand and verify the concept of the proposed method, in future work we will evaluate our approach using experimental data that contains photon interactions within the scintillator and more sophisticated detector characteristics.
Participating Researchers